

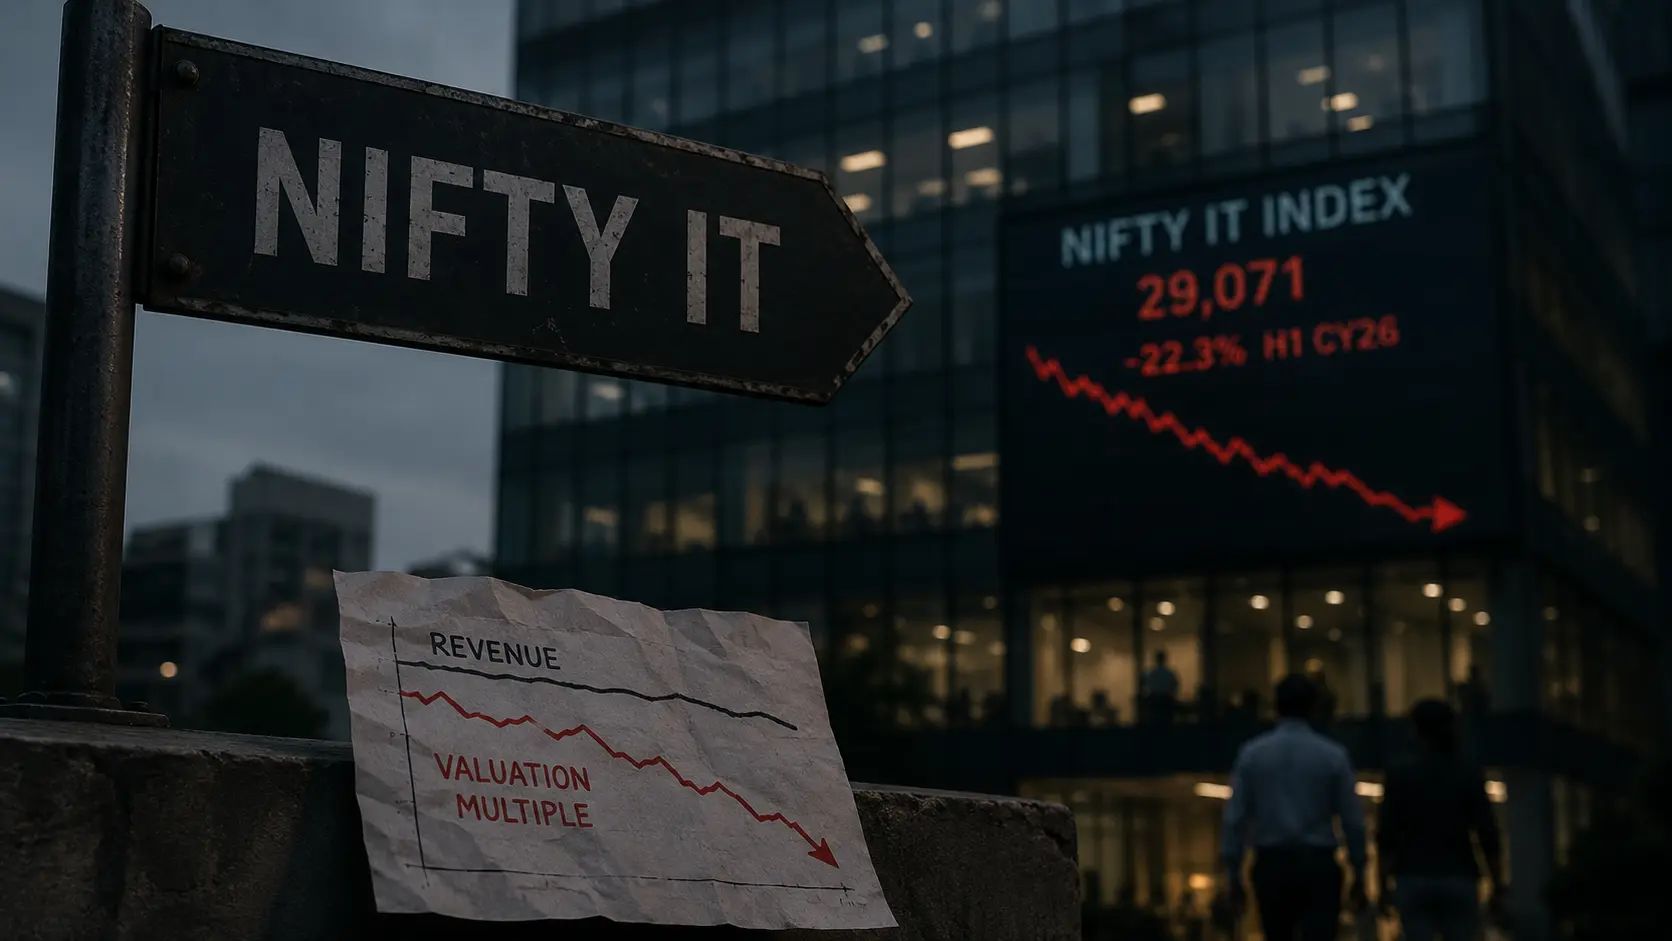
In the context of the accelerating stock market, where investors stand on algorithmic signals and headline earnings per share (EPS) numbers, it is easy to lose sight of the more foundational, structural forces behind equity valuation. We track a company's top-line revenue growth and assume that stock price performance will follow the same simple, linear path. But, as the first half of calendar year 2026 (H1 CY26) has proven emphatically for the Indian Information Technology sector, that reasoning can be utterly turned on its head.
Many armchair traders were completely flummoxed by the performance of the Nifty IT index during H1 CY26. Revenue headline prints from mega-caps such as Tata Consultancy Services (TCS), Infosys and HCL Technologies did not come crashing down; rather, constant-currency revenue growth numbers held up exceedingly well, comfortably meeting or mildly surpassing the pared-down guidance bands. Yet the stock prices dived, with the index tumbling and individual marquee large-caps taking a beating — losses of 34% to 38% of their market value from prior peaks. Where is the disconnect? How do we reconcile a business that is flat-to-modestly growing with a stock that is collapsing?
"In accounting, the valuation multiple is a result: P/E = Price / EPS. But in active equity valuation the multiple is a directly observable input: Price = EPS × P/E. When sentiment in the market turns, the multiple compresses long before the financial statements show a deceleration."
The Core Thesis: Multiple Compression Explained
A proper understanding of H1 CY26 requires us to view valuation through the lens of investor expectations, not historical reporting. The normal Price-to-Earnings (P/E) ratio is calculated by dividing the current price by earnings. But the market is working in advance. The multiple is a proxy DCF model and hence embeds all the expectations of future growth, risk, and interest rates. In the minds of institutional investors, when these expectations shift, the multiple shifts instantaneously.
Following a rough start to 2026, the Nifty IT index found itself locked in a ferocious internal scramble. On one hand was the fundamental truth: predictable revenue streams, consistent execution, and multi-year cloud transformation deployments. On the other hand, there was a dramatic cut to the long-term multiple that global and local funds were prepared to assign to headcount-centric outsourcing models. This phenomenon is multiple compression — where a company's earnings grow or stay flat, but its share price falls because the market decides it will pay less for a rupee of earnings.
Let us now examine why a flat price for steady earnings represents a structural shift. If a company grows its net profits at 20% organically but its stock price gets absolutely nowhere, the market has managed to engineer a large multiple contraction. Investors have concluded that the company's future cash flows are either more risky, or less durable, than the market had previously assumed.
H1 CY26 Detailed Analysis: Revenue vs. Valuation
The H1 CY26 data is irrefutable. The Nifty IT index, which had breached key structural highs in late 2025 near 40,301, came under strong correction and was seen around the 29,071 level by midyear — a rapid correction of about 22% to 28% in the major index. The aggregate trailing P/E multiple of the Nifty IT rose from its discount levels to a bloated 28.15x at the end of January, then plummeted to a lean 17.26x by the end of June 2026 — a level well below its long-term multi-year historical average of 18.8x.
To appreciate how deep this compression is, it is instructive to examine the returns of the individual index components over the first half of 2026:
| Company Name | Index Weight (%) | H1 CY26 Drawdown (From Peak) | FY27 Constant-Currency Revenue Guidance | Trailing P/E Compression Level |
|---|---|---|---|---|
| Infosys Ltd. | 30.41% | -34% to -38% | +1.5% to +3.5% | Multi-year low (~16.2x) |
| Tata Consultancy Services (TCS) | 20.48% | -25% to -27% | Stable deal pipeline (mid-single digit) | Compressed to 18.1x |
| HCL Technologies Ltd. | 11.16% | -20% to -23% | Strong software product mix insulation | Compressed to 15.9x |
| Wipro Ltd. | 5.94% | -28% to -30% | Flat to marginal growth | Compressed to 14.8x |
The table shows a stark imbalance. Infosys, for example, completed strategic buys like Optimum Healthcare IT to expand its North American presence and reported stable operating margins of 21%. Yet its stock was under heavy selling and closed near 52-week lows. This shows that stock price action was driven not by the company suddenly failing to operate, but by a re-evaluation of a company's long-term structural merit.
The H1 CY26 Valuation Reset Catalysts
Three powerful H1 CY26 macro and structural catalysts converged to fuel this brutal multiple contraction throughout Indian IT stocks:
Advertisement
1. The Generative AI Headcount Disruption Narrative
The typical Indian IT services model is fundamentally linear and headcount-based: revenue growth is directly tied to billable software engineering hours. In H1 CY26, advanced agentic AI systems becoming mainstream shifted institutional thinking. Institutional desks started to price in a future in which auto-AI agents write routine code, testing, and legacy maintenance for a fraction of the cost. There was worry that clients might seek big price discounts in contract renewals, effectively capping long-term margin potential for the traditional outsourcers.
2. Dramatic Outflow of Foreign Portfolio Investors (FPI)
The first half of 2026 recorded the largest-ever outflow from Indian secondary markets. In single months like March 2026, FII outflows zoomed past a staggering ₹52,704 crore. Because large-cap IT stocks such as TCS and Infosys are very liquid and constitute a significant portion of FPI holdings, these were the key liquidity taps for overseas funds fleeing emerging markets. This relentless technical selling, coupled with the structural down-pressure on stock prices, kept multiples moving lower regardless of company earnings.
3. Macroeconomic Pressure and Elevated US Federal Rates
With leading North American corporate customers facing enduring economic conservatism, discretionary tech spending was tightly constrained. In addition, the US Federal Reserve's prolonged high interest rates sustained elevated hurdle rates for global capital. Long-duration growth assets — such as technology companies, whose valuations are heavily based on distant future cash flows — take immediate valuation hits on account of higher discount factors in financial models when the cost of capital is high.
"Spend consciously on macro analysis and save intentionally from entering overvalued cycles. The price action of H1 CY26 is a masterclass in separating operational revenue from systemic valuation risk."
Historical Framework and Rebound Probability

While the over-22% YTD plunge in the Nifty IT index is one of the harshest starts to a calendar year since the 2008 global financial crisis, historical market cycles indicate that periods of intense multiple de-rating often precede good long-term returns. Long-term equity data across various market cycles since 2001 demonstrate that large-cap forward P/E multiples compressing below their long-term means (down into the 15x to 17x zone) has been followed by a one-year subsequent absolute return recovery of about 18.6%.
By the end of June 2026, indications of short-term support were developing near the 24,000 level for the broader Nifty 50, with technology firms climbing 3% to 5% in tactical one-day rallies as value-driven domestic institutional investors began to pick up compressed large-cap stocks. Forward earnings estimates for FY27 and FY28 are robust as well, with Nifty corporate PAT growth projected at 14.3% and 16.5% respectively. If earnings trends remain intact, the fact that multiples are currently so low means that any sign of stabilization in global interest rate policy or AI anxiety could spark a material re-rating in the second half of 2026.
Conclusion: The Ultimate Technical Takeaway
The actual narrative of H1 CY26 is an essential takeaway for all equity holders: revenue performance tells us what happened yesterday, but multiple adjustments tell us what the market fears for tomorrow. The sudden reversal in Indian IT was a valuation-driven recalibration rather than a business collapse. For savvy investors, the compression of multiples has taken a foamy layer off — turning an über-priced growth play into an extremely well-structured, value-backed option on the next leg of the technology cycle.
Read Further
- Nifty IT Has Crashed Almost 24% From Its Peak. Should You Buy or Stay Away? — Sahi, updated June 25, 2026
- Infosys Completes Acquisition of Optimum Healthcare IT — Infosys Newsroom, May 2026
Disclaimer: The detailed analysis provided in this report is compiled strictly from public market data, index disclosures, and equity research studies. This document is intended entirely for educational and analytical purposes and must not under any circumstances be construed as definitive financial, legal, or investment advice.
Advertisement