

In today's era where everything is being driven by massive retail liquidity injections and systemic shifts across the Indian economic spectrum, we are seeing a strange and unprecedented divergence inside the benchmark indices. We are too much dependent on traditional indices like the Nifty 50 to gauge the health of the entire stock market, and somehow it is useful for us and somehow it is not. The frontline large-caps represent the global face of Indian corporate power, structured and institutionalized, yet they have struggled to spark the same ferocious adrenaline that the broader market has routinely delivered over the last few years. The financial markets were built to reflect the underlying corporate earnings velocity with absolute precision and better efficiency. But when we look closely at how market participants have transitioned their capital allocations into mid-caps, small-caps, and obscure micro-cap systems, we observe a radical paradigm shift. We don't know where we actually left behind the conservative methods of large-cap dependency and risk aversion; we don't know when the entire retail ecosystem became structurally dependent on high-beta momentum plays.
This article basically is going to get you all aware about what is happening with the Nifty 50 vs the Small-Cap indexes, and what we should do with authentic, original value investing principles versus aggressive modern momentum architectures to successfully manage our portfolios.
Frontline Large-Caps and the Stability They Provide
With the expansion of institutional domestic capital, large-cap investing has become much more organized and highly efficient to balance systemic shocks in our personal finance journeys and corporate balance sheets. Frontline equities like the components of the Nifty 50 act as the stabilizing ballast of the Indian financial cosmos. These mega-caps operate as highly mature financial systems that analyze macroeconomic cycles, forecast global supply chains, automate large-scale capital expenditures, and deliver highly structured dividend distributions with minimal downside surprises during global panics. These massive blue-chip systems provide invaluable security while managing your finance and long-term retirement accounts, anchoring key decisions for generational wealth expansion. However, as global central banks fluctuate and Foreign Portfolio Investors (FPIs) alter their risk models based on international interest rate shifts, the Nifty 50 has frequently felt heavy, sluggish, and bogged down by its own sheer weight. While the index tests critical breakout zones like the 24,000 mark, its upward march has been a grinding chore, heavily influenced by sector heavy weights in financial services and information technology that remain tightly linked to global economic headwinds.
Key Frontline Tracking Frameworks:
- Nifty 50 Index: The absolute blue-chip benchmark tracking the 50 largest, most liquid Indian enterprises.
- Nifty Next 50: The next layer of emerging large-caps bridging the gap to the mid-cap space.
- BSE Sensex: The traditional 30-share bastion of Indian corporate industrial strength.
- Nifty 100: A comprehensive large-cap matrix capturing over 65% of the total free-float market capitalization.
Cons of Focusing Solely on Nifty 50 or Overvalued Small-Caps
Market indices are, at their core, mathematical representations of sentiment and liquidity, not independent thinking brains that can calculate endless possibilities in every historical scenario. In recent studies across Indian market cycles, a major divergence has appeared when investors look strictly at top-line index returns without examining underlying valuations. In recent periods, while the Nifty 50 experienced phases of stagnation or modest single-digit drawdowns, the underlying small-cap indices exhibited wild, structural gaps. For instance, the Price-to-Equity (PE) ratio of the Nifty Smallcap 250 index shot up to an astounding 35.3, dramatically higher than its long-term 5-year median of 28.2. Similarly, the Price-to-Book (PB) ratio crawled to 3.8, significantly breaching its structural historic anchor of 3.6. This massive inflation reveals a dangerous valuation gap. Historical data highlights that a vast difference in performance accuracy emerges when retail money chases broader market momentum blindly. Statistically, every 2nd out of 5th attempt by small-cap enterprises to scale their corporate earnings to match their stock prices fails. This leaves an error in portfolio allocation which, if not destructive in short-term household trading, can get long-term investors into severe, permanent capital losses during structural corrections. Chasing overvalued counters without studying free-cash flows turns into an endless loop of tracking flawed financial records, forcing frequent strategy shifts that become a tiresome chore, yielding immense psychological stress and financial migraines.
The Traditional Value-Driven Engine: Small Caps and Microcaps
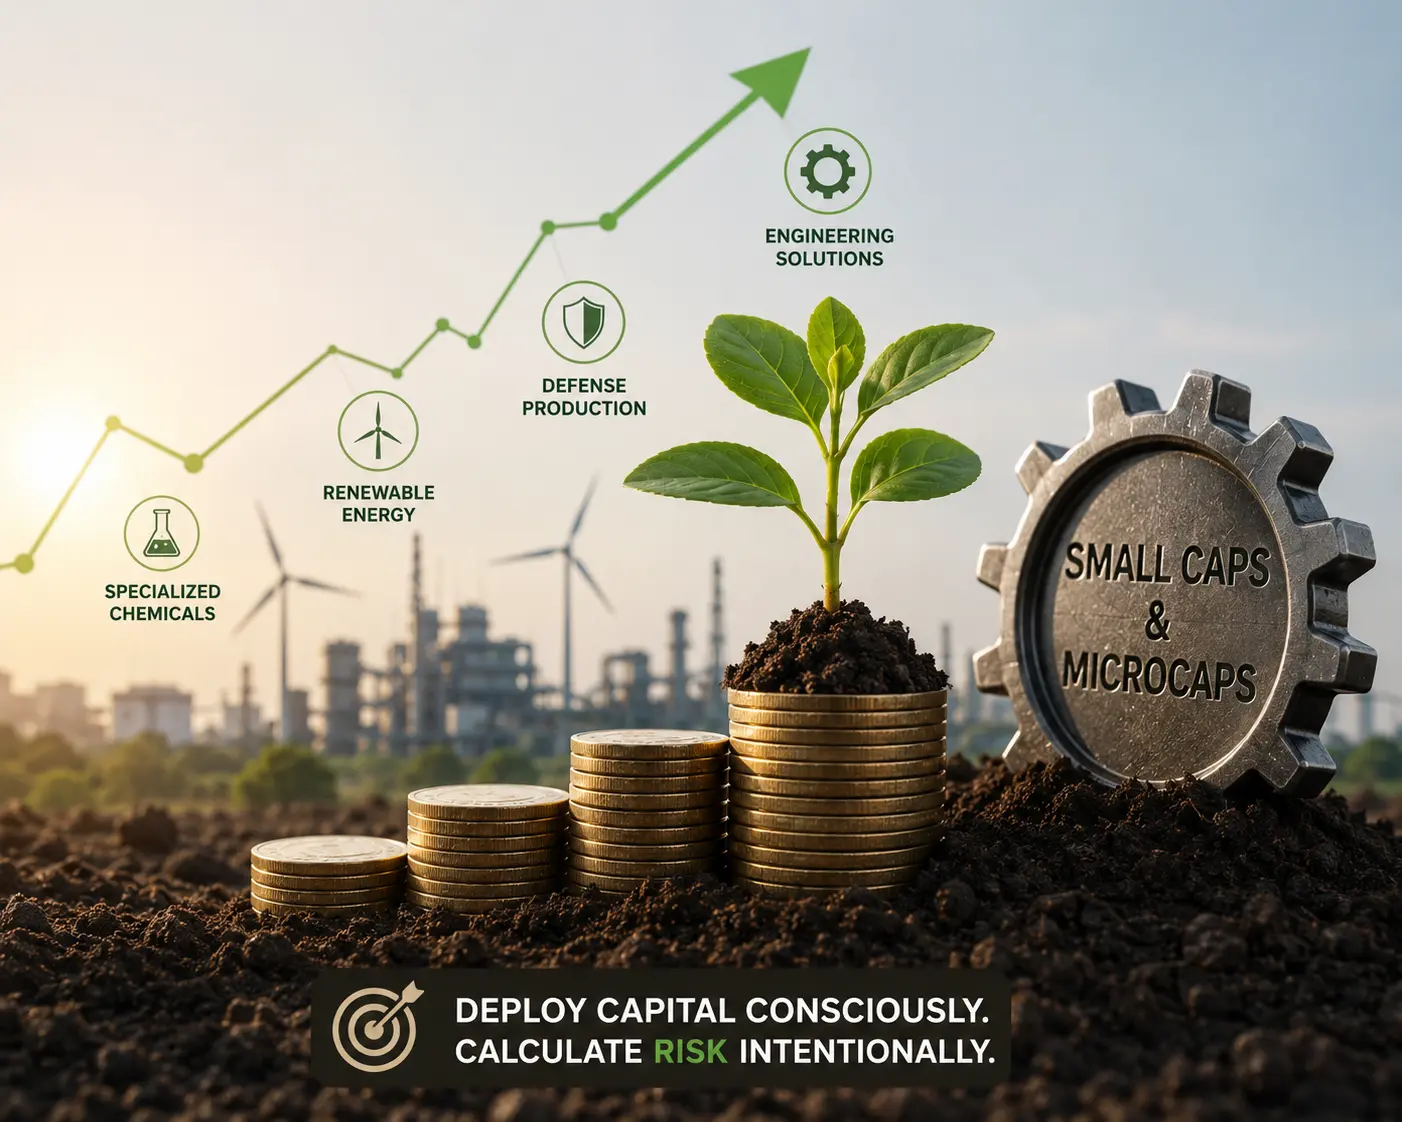
The small-cap and micro-cap ecosystem represents the traditional, raw, and hyper-growth entrepreneurial engine of the Indian economy. Just like a personal ledger keeps track of raw transactions before they are institutionalized, small-cap indices capture corporate India in its most ambitious, high-risk format. The National Stock Exchange categorizes companies ranked beyond the top 250 by market capitalization as the broader small-cap universe, which is captured across distinct sub-indices depending on stock counts and specific concentration limits. Unlike mature, slow-moving large-caps, small-cap frameworks focus entirely on aggressive market capture, rapid execution, and operating leverage. These companies are deeply embedded in India's domestic structural themes — such as specialized chemicals, renewable energy infrastructure, localized defense production, and niche engineering platforms. When domestic demand picks up, these agile companies experience explosive earnings velocity. This allows agile mutual fund managers and tactical retail participants to generate exceptional, market-beating alpha that leaves standard large-cap trackers far behind.
"Deploy capital consciously and calculate risk intentionally."
The Phenomenal Divergence: Data and Market Facts
To comprehend how India's equity architecture is splitting completely in two, one must move past superficial narratives and evaluate hard financial metrics. The modern Indian marketplace is no longer moving in unison; it has bifurcated into a high-stability, lower-growth large-cap outer crust and a hyper-volatile, liquidity-driven broader market inner core. The historical trajectories of the index gaps prove this point with absolute clarity.
| Index / Metric Matrix | FY26 Annual Performance | Long-Term 15Y CAGR | Current Valuation PE | Risk-Adjusted Sharpe Ratio |
|---|---|---|---|---|
| Nifty 50 (Large-Cap) | +10.10% | 12.10% | 21.50 | 0.29 |
| Nifty Midcap 150 | +14.50% | 15.80% | 29.20 | 0.45 |
| Nifty Smallcap 50 | +17.76% | 11.83% | 32.10 | 0.31 |
| Nifty Smallcap 100 | -4.93% | 13.40% | 25.91 | 0.33 |
| Nifty Smallcap 250 | -4.84% | 14.90% | 35.30 | 0.35 |
| Nifty Microcap 250 | -1.81% | 15.20% | 38.40 | 0.40 |
This table exposes a fascinating structural anomaly across the Indian index landscape. During recent fiscal cycles, a massive 22.69 percentage point gap opened up between the Nifty Smallcap 50 (+17.76%) and the Nifty Smallcap 100 (-4.93%), despite both pulling from the exact same underlying company pool. This occurs because the Smallcap 50 was heavily concentrated in top-performing financial services and healthcare counters, showcasing that small-cap indices can behave in completely disconnected ways. Meanwhile, the broader Nifty Smallcap 250 index trading at a premium PE of 35.3 vs its historic baseline sounds a loud warning bell for value discovery. When we look at the multi-decade journey, the data tells an even more profound story. The average calendar year return for the hyper-aggressive Microcap index stands at an impressive 26.2%, yet its actual compounded annual growth rate (CAGR) drops down to 15.2% due to catastrophic drawdowns during market contractions. For instance, in brutal down-cycles like 2008 or 2018, while the Nifty 50 fell by manageable margins or stayed flat, smaller indices completely collapsed, shedding between 69% and 75% of their total value within single calendar periods. This proves that the smaller the stock, the higher the raw returns during euphoria, but the rougher the structural ride across extended horizons.
Achieving Harmony: The Balanced Allocator's Path
Now, it may sound like an absolute choice between selecting either secure frontline systems or volatile broader market growth engines, but the real secret lies in cognitive awareness and disciplined allocation. When you write down, track, and balance your financial plans yourself, your mind becomes fully aware of the risk premiums you are taking. You understand immediately whether it is correct or deeply flawed to chase an overvalued small-cap story or accept a sluggish large-cap return profile. The successful modern investor must employ a dual-engine architecture: utilizing the Nifty 50 and large-cap mutual funds as an unshakeable defensive base to safeguard capital against global macro shocks, while systematically utilizing disciplined Systematic Investment Plans (SIPs) in diversified setups like the Nifty Smallcap 250 index to capture the raw, explosive industrial growth of developing India. By forcing yourself to pause and double-check valuations before deploying capital, you practice the core principles of elite wealth management and long-term portfolio survival.
Strategic Allocation Reference Blueprints:
- Core Tactical Stability: Keep 50-60% of equity allocations in institutional Large-Caps or Nifty 50 low-cost index funds to preserve capital.
- Growth Alpha Accelerators: Allocate 20-30% into structured Midcap 150 frameworks to capture mid-stage corporate scaling.
- Broader Market Satellites: Maintain 10-20% in broad-based Smallcap 250 index strategies, entirely avoiding extreme single-stock concentration.
Read Further
- Nifty Smallcap 250 PE Ratio — Moderately Overvalued: Current vs 7-Year Median — IndexPE Valuation Analyzer
- Analyzing NIFTY Smallcap Indices: A Deep Dive into Historical Returns — BMS Money
Disclaimer: All the data and factual comparisons provided above were compiled from historical exchange records, public market studies, and financial index factsheets. This should not be taken as a formal quote or personalized financial advice.