
In today's modern era, where financial markets are increasingly guided, analyzed, and traded by hyper-advanced algorithms, predictive systems, and high-frequency autonomous platforms, we find ourselves completely surrounded by technology. We have grown deeply dependent on automation to safeguard our financial well-being. It is highly convenient, offering seamless execution and immediate numbers, making everything appear optimized on paper. Yet, just as we often yield our daily habits and tracking systems to autonomous chatbots — forgetting the core human discipline of deliberate tracking — we also blindly delegate our risk management to market models. In doing so, we have forgotten the older, battle-tested mechanics of market cycles, psychological discipline, and structural awareness. We don't realize where we actually lost the raw, organic baseline of financial self-preservation amidst a sea of blinking green and red dashboard metrics.
"The market is not an automated calculation machine built on perfect predictability; it is a manifestation of collective human psychology, structural vulnerabilities, and cyclical hubris."
This comprehensive analysis is designed to restore that lost awareness. By stripping away modern optimization theater and deeply investigating the mechanisms, data points, and structural failures of history's most severe market crashes, we uncover timeless laws of capital allocation. Technology can execute trades faster and with incredible efficiency, but it cannot fundamentally cure human panic, structural leverage, or systemic blindness. To thrive across decades, an investor must study the structural design of past collapses, understanding exactly what we should trust to systems and what we must retain within our own conscious, disciplined human mindset.
The Anatomy of Modern Market Collapses and Structural System Failure
Every historic market disruption follows an eerily consistent lifecycle: an initial technological or structural catalyst, an environment of extreme systemic leverage, a failure of mathematical risk models, and a rapid, uncontrolled cascading correction. When investors look back at market crashes, they often view them as isolated, unpredictable anomalies — frequently termed "Black Swans." However, a rigorous, data-driven look into historical realities proves that these crises are almost always systemic corrections triggered by human over-reliance on flawed safety assumptions. In modern finance, the danger has mutated. High-frequency trading (HFT) and algorithmic market-making systems have created a profound illusion of endless liquidity. Under normal market conditions, these models ensure that trades occur within milliseconds at fractions of a cent in spread. But when a true crisis hits, these autonomous algorithms do not act as stabilizing forces. Instead, they act as mechanical actors programmed to instantly withdraw capital, pull back their bids, and protect their own balance sheets. This creates a terrifying dynamic where liquidity completely vanishes precisely when the market requires it most, transforming a standard correction into an absolute tailspin.
The Accuracy Trap of Automated Risk Modeling: Much like modern generative tools that show high historical consistency but fail spectacularly under non-linear stress, financial risk models like Value at Risk (VaR) frequently exhibit a severe "blind spot." They calculate probabilities based on standard distributions (the classic Gaussian Bell Curve), completely underestimating the fat-tail events that actually dominate real market history.
| Historical Market Crisis | Peak-to-Trough Decline | Primary Systemic Catalyst | Key Investor Failure |
|---|---|---|---|
| The Great Crash (1929) | -89% (DJIA Peak to 1932 Trough) | Excessive Margin Leverage & Lack of Regulation | Speculating with Borrowed Capital |
| Black Monday (1987) | -22.6% (Single Day - Oct 19) | Portfolio Insurance & Programmed Trading | Blind Reliance on Automated Stop-Loss Systems |
| Dot-Com Crash (2000) | -78% (NASDAQ Composite) | Irrelevance of Earnings & Capital Euphoria | Valuing Narrative Above Cash Flow Metrics |
| Global Financial Crisis (2008) | -57% (S&P 500) | Subprime Debt Leverage & Corrupted Derivatives | Trusting Highly Complex, Layered Risk Products |
| Flash Crash (2010) | -9% (Intraday Collapse in Minutes) | High-Frequency Spoofing & Algorithmic Panic | Assuming Continuous, Automated Market Liquidity |
Deep-Dive Case Studies: Facts, Mechanics, and Structural Destructions
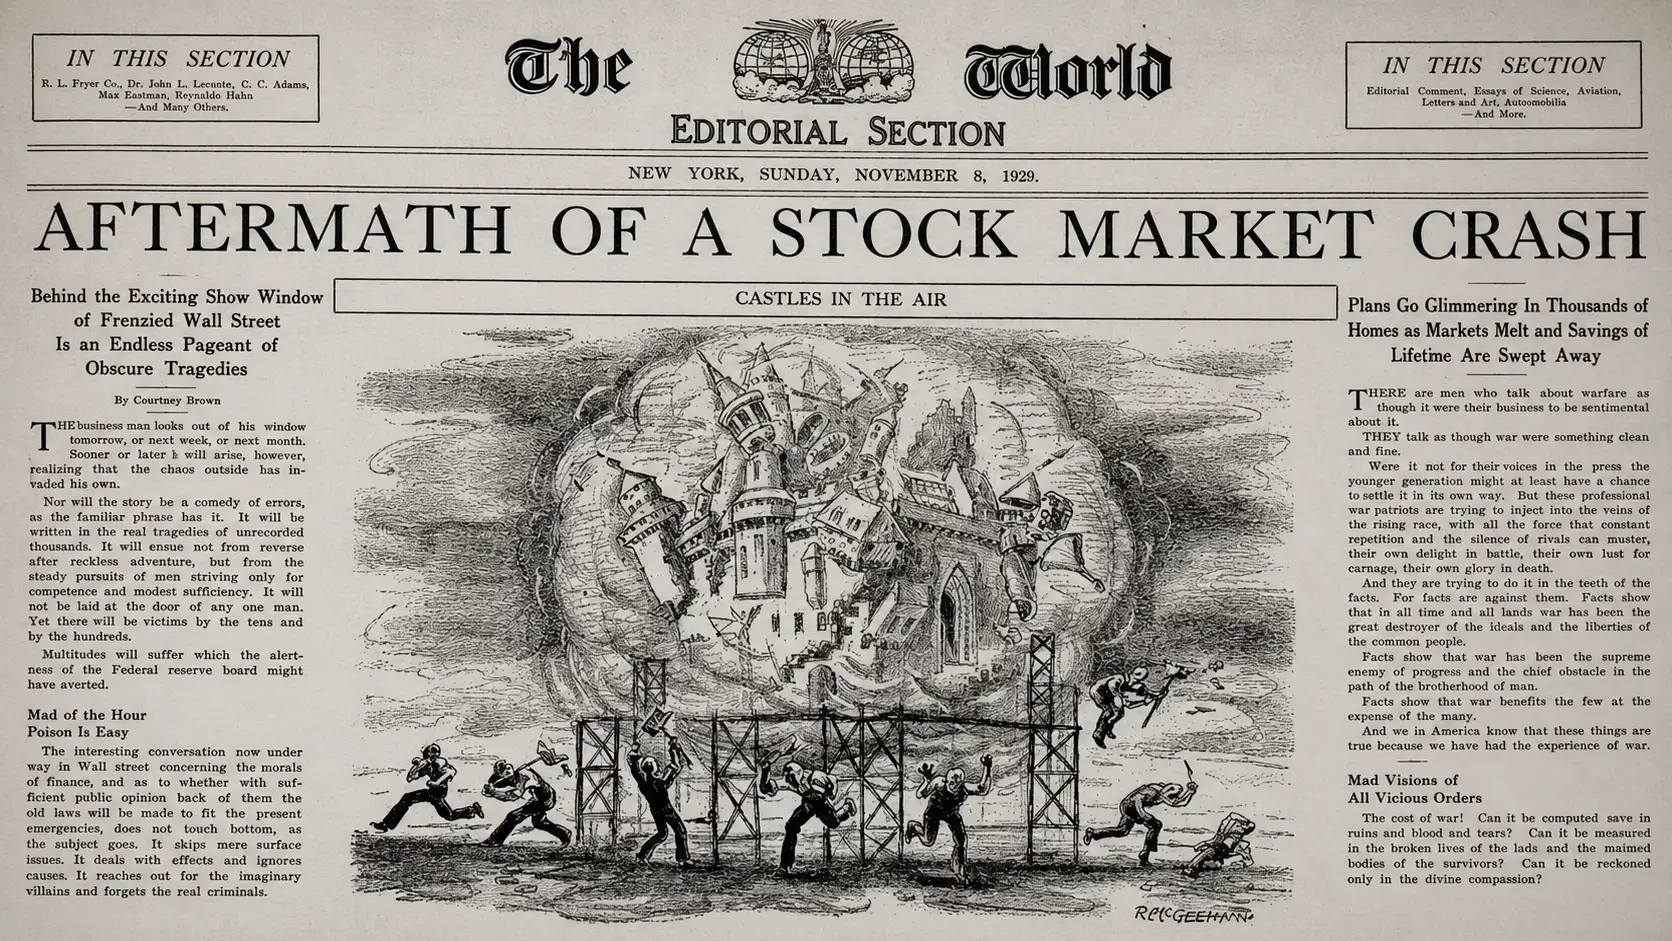
The Panic of 1929: The Illusions of Unlimited Leverage
The roaring twenties created a cultural narrative that the American economy had entered a permanent plateau of prosperity. Driven by the rapid industrialization of automobiles, radios, and household electrification, corporate profits soared. However, the true underlying mechanism of the 1929 crash was structural leverage through broker loans. In the late 1920s, ordinary retail investors could purchase equities on a 10% margin requirement. This meant that with just $100 of physical capital, an individual could purchase $1,000 worth of stock, borrowing the remaining $900 directly from the brokerage firm. By the autumn of 1929, outstanding broker loans had surpassed an astronomical $8.5 billion, a sum that exceeded the total value of all physical currency circulating throughout the United States at the time. When the market experienced minor structural liquidations in mid-October, brokerages were forced to issue immediate "margin calls." Because retail investors did not possess the cash reserves to cover their leveraged accounts, brokerages summarily liquidated those stocks onto the open market. This structural selling triggered further price drops, prompting more margin calls, and resulting in an uncontrollable downward spiral. On Black Tuesday — October 29, 1929 — over 16 million shares were aggressively dumped in a single session, completely destroying the financial system and wiping out decades of accumulated capital within weeks.
Black Monday 1987: The First Blind Failure of Automated Systems
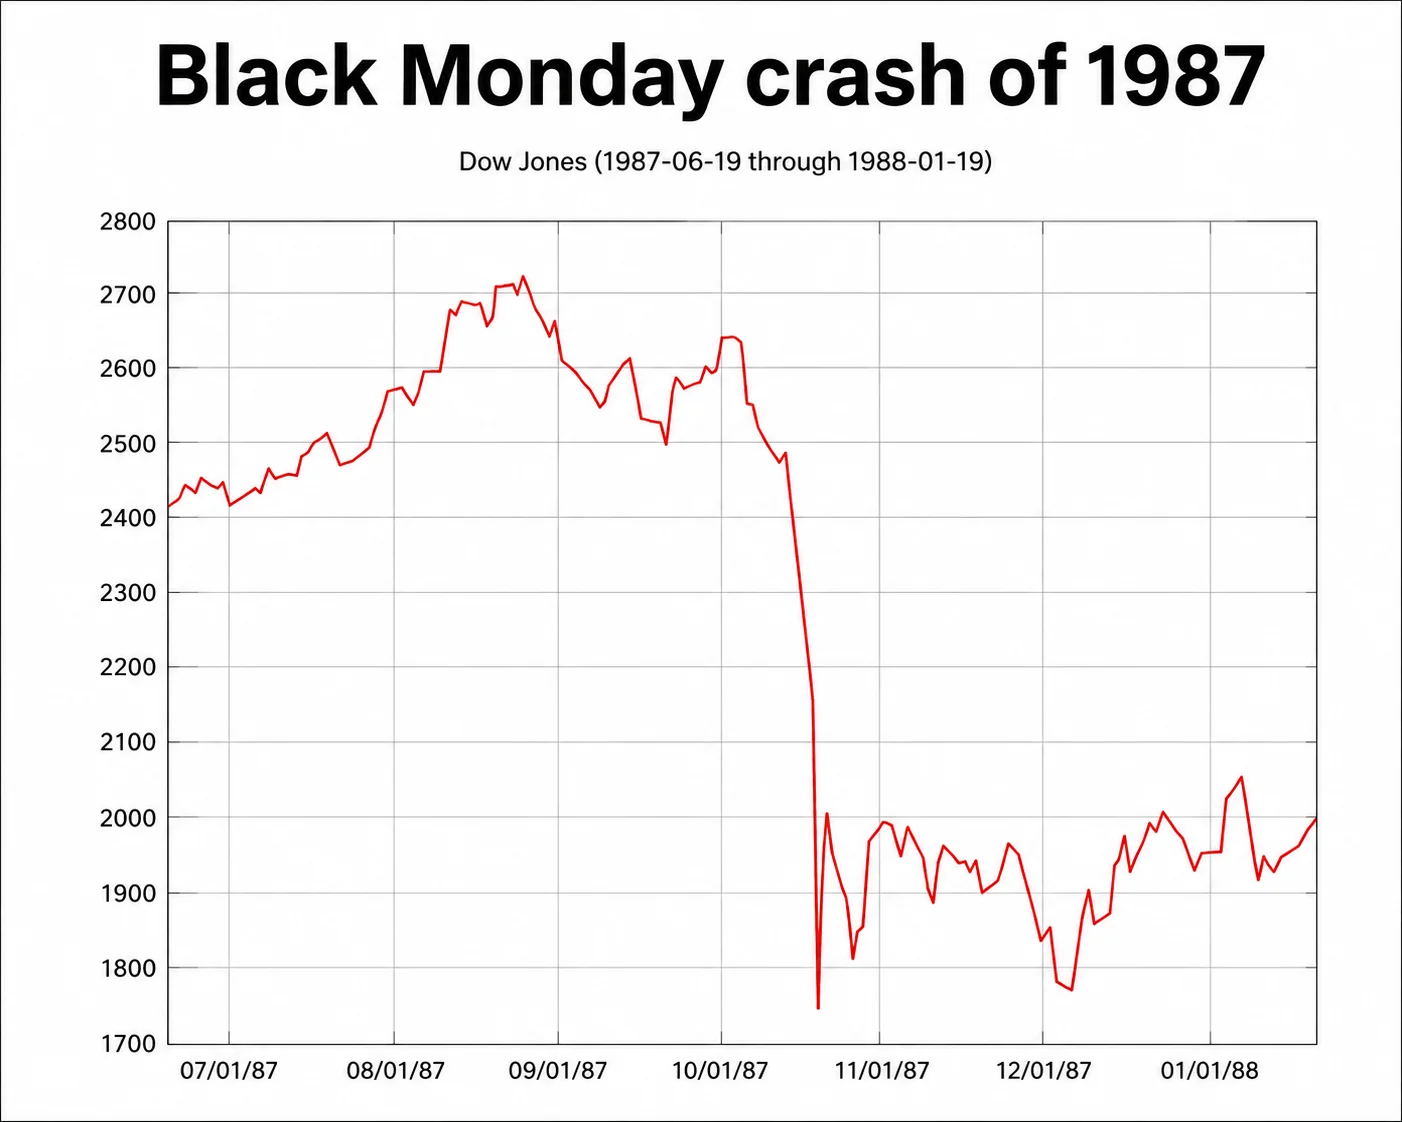
If 1929 was a testament to the dangers of human greed and physical debt, October 19, 1987, was the first true warning sign of automated and algorithmic systemic vulnerability. In the mid-1987 environment, institutional money managers had widely adopted a new risk-mitigation product known as "Portfolio Insurance." Designed by prominent academic economists, portfolio insurance relied on complex computer programs to dynamically hedge stock portfolios by automatically shorting stock index futures contracts whenever equity prices dipped past specific thresholds.
"The systems were designed to protect individual portfolios automatically, but when every institutional computer attempted to execute the exact same defensive programmatic script simultaneously, they completely choked the system, creating a mechanical feedback loop of catastrophic selling."
When the market opened lower on Monday, October 19, following weak macroeconomic data and rising geopolitical tensions, the institutional insurance models immediately fired off automated sell orders into the futures pits. This rapid influx of futures sell orders drove futures prices down below the cash value of the underlying stocks. Arbitrageurs spotted this discrepancy and immediately bought the cheap futures while simultaneously dumping massive blocks of actual underlying shares on the New York Stock Exchange. The programmatic systems, seeing stock prices plunge further, responded precisely as they were coded to do: they generated even larger automated sell orders. This closed mechanical loop caused the Dow Jones Industrial Average to plunge a staggering 22.6% in a single trading session — the largest single-day percentage drop in financial history, highlighting how automated safety mechanisms can accelerate systemic destruction.
The 2000 Dot-Com Bubble: Narrative Euphoria vs. Real Valuation
The late 1990s represented a profound psychological displacement where traditional finance and asset evaluation metrics were discarded in favor of pure, unchecked narrative speculation. The commercialization of the internet led to the widespread belief that old economic laws — specifically regarding net earnings, price-to-earnings (P/E) ratios, and free cash flows — were entirely obsolete. Companies with zero revenues, no proprietary technology, and no viable pathway to profitability were celebrated simply for adding a ".com" suffix to their corporate names. The structural vulnerability of the Dot-Com era lay in the metric distortion. Wall Street institutional analysts began using absurd, unquantifiable metrics such as "eyeballs," "mindshare," and "burn rate" to justify valuations that defied mathematical reality. At the height of the bubble in March 2000, the price-to-earnings ratio of the NASDAQ Composite index reached an astronomical 175x. When companies repeatedly failed to hit their revenue targets, and early venture capital backers faced the end of their regulatory insider lock-up periods, institutional capital quietly began converting equity into cash. The market soon realized that these businesses were burning through capital with no sustainable operational core. The NASDAQ lost an incredible 78% of its total value over the ensuing two years, liquidating trillions of dollars in speculative capital and sending a clear signal that narrative can never permanently outrun cash flow.
The 2008 Great Financial Crisis: The Myth of Diversified Toxic Assets
The Global Financial Crisis of 2008 represents perhaps the most mathematically sophisticated and structurally complex breakdown in market history. At its core, the crisis was built on a single, flawed structural premise: that pooling thousands of high-risk, subprime mortgages across various geographic regions could mathematically neutralize the default risk of individual loans. Wall Street financial engineers used complex mathematical models called Gaussian Copulas to bundle these unstable debts into structured financial instruments known as Collateralized Debt Obligations (CDOs). These instruments were then given pristine, AAA investment-grade ratings by credit rating agencies.
$1.3 Trillion — Approximate size of the subprime mortgage market by 2007, heavily securitized into complex structural derivatives.
30 to 1 — The extreme leverage ratios maintained by major investment banks like Lehman Brothers, leaving no room for asset devaluations.
The structural flaw became fatal when U.S. housing prices experienced their first systemic, nationwide decline since World War II. The mathematical models had assumed that real estate markets were highly localized, operating on the premise that a downturn in Nevada would not correlate with one in Florida. In reality, the correlation went straight to one. As interest rates reset higher, subprime borrowers defaulted en masse. Because major Wall Street investment banks were operating on extreme leverage ratios of 30-to-1, a minor 3% to 4% decline in the value of their underlying asset books instantly rendered these institutions functionally insolvent. The sudden collapse of Lehman Brothers in September 2008 froze global credit markets entirely, demonstrating that hiding structural risk inside complex mathematical abstractions is an invitation to systemic collapse.
The Flaws of Algorithmic Safety and the Imperative for Human Intervention
In our current environment, we see a widespread trend toward total financial automation. Platforms promise that by using deep learning algorithms, automated rebalancing, and programmatic stop-losses, an investor can completely optimize their return profile without ever experiencing the emotional discomfort or mental strain of market cycles. This is the ultimate operational illusion. While these tools calculate numbers with flawless precision, they lack a human mindset capable of processing qualitative, unprecedented shifts in structural dynamics. They are backward-looking models trained on past data sets, operating under the assumption that the future will always look like a variation of the past.
When an investor depends entirely on automated safety triggers, they introduce a massive hidden vulnerability into their strategy. For instance, programmatic stop-loss orders are designed to liquidate an asset the moment it hits a specific price floor, protecting capital from further downsides. However, during a systemic flash crash, prices do not decline smoothly. They gap downward instantly. An automated stop-loss order designed to execute at $90 might find no bids available until the asset hits $65, locking in catastrophic, permanent capital losses at the absolute bottom of the market cycle. This repetitive process turns what should be a temporary paper drawdown into an unrecoverable structural hit.
True risk management cannot be cleanly outsourced to a passive script or an automated dashboard. It demands active human reflection, structural skepticism, and a deliberate willingness to value capital preservation over theoretical optimization. The solution does not lie in rejecting modern financial tools entirely, but in completely changing our operational relationship with them. Automation should be confined to administrative execution — reinvesting dividends, facilitating base transactions, or maintaining basic portfolio targets. The overarching strategic core, risk assessment, and long-term capital defense must remain anchored in a deeply disciplined, deliberate human mindset. Just as the traditional Kakeibo system uses handwritten reflection to force an individual to consciously process every single transaction, an investor must manually document, review, and stress-test their core financial assumptions away from the chaotic influence of real-time market screens.
Timeless Lessons and Strategic Frameworks for Long-Term Wealth Preservation
To insulate personal capital from the inevitable structural breakdowns of global financial markets, an investor must move away from reactive tactics and establish a highly disciplined structural framework based on historical constants. The absolute rules of wealth preservation have not changed in hundreds of years. They require structural humility, strict control over leverage, an unyielding focus on cash generation, and a strategic embrace of market volatility.
Eliminate Structural and Synthetic Leverage: The primary accelerator of every historic market crash is the forced liquidation of leveraged positions. When you invest using purely your own unleveraged capital, a 30% market correction is simply a temporary drop in paper value. But if you are leveraged 3-to-1, that exact same 30% correction completely wipes out your entire capital base, leaving you permanently excluded from the subsequent recovery.
De-link Portfolio Value from Pure Narratives: Always ensure that your core equity investments are anchored by clear, quantifiable metrics: growing free cash flows, durable defensive moats, sustainable debt-to-equity ratios, and real operational earnings. Never allocate core capital to an asset whose entire valuation is built on the hope that someone else will pay a higher price for a narrative in the future.
Maintain a Fully Separated, Strategic Liquidity Reserve: A true safety net must be kept completely separate from the active investment infrastructure. This liquidity should not be deployed in short-term yield-seeking instruments that could easily freeze during a broader systemic banking crisis. Having immediate access to uncorrelated cash guarantees that you are never forced to liquidate your core long-term equity positions at the absolute bottom of a crash to cover real-world operational needs.
Practice Radical Cognitive Reflection: Establish a structured, manual review process for your portfolio. Write down the precise operational thesis for every major asset allocation. If the market undergoes a severe correction, return to your written thesis to determine if the structural core of the business has changed, or if the decline is simply driven by temporary algorithmic liquidation. This manual practice interrupts the emotional panic loop, enabling disciplined, long-term decision-making.
Read Further
- Stock Market Crash of 1929 — Federal Reserve History
- The Dot-Com Bubble — Wikipedia: NASDAQ Composite's 78% Decline from Peak
Disclaimer: All the structural data, historical parameters, and case study details provided in this document are derived from public financial records, academic economic resources, and historical market studies. This analysis is presented purely for informational and educational purposes and must not be taken as an official quote from our website or construed as personalized financial, investment, or legal advice. Investors must conduct their own independent due diligence before allocating capital.