
In today's era where everything is being analyzed, predicted, and quantified by complex institutional models and automated retail applications, we are becoming fundamentally dependent on top-line market momentum and ticker-tape hype. Somehow, this instant accessibility is useful for us — it allows rapid execution and democratization of market entries — but somehow it is completely not. When we hand over our critical thinking to automated stock-screener ratings, simple color-coded analyst summaries, and programmatic algorithms that tell us what is trending or "bound to break out," we lose touch with the underlying reality of corporate economics. We end up moving so fast that we don't know where we actually forgot the old, meticulous methods of manual auditing, fundamental assessment, and rigorous investor discipline. We don't know.
Artificial intelligence and automated stock scanners were created to make our initial market filtering faster and execute with greater systemic efficiency. However, when an investor relies solely on passive indexing or autonomous "buy/sell" ratings from online platforms without examining the cold, unvarnished truth of a company's balance sheet, disaster is only a market cycle away. Modern market platforms present shiny dashboards full of geometric return charts, glowing moving average indicators, and optimistic price targets. Yet beneath these sophisticated digital projections often lies structural rot — companies drowning in toxic capital structures, manipulating numbers via accounting trickery, or experiencing systemic product decay.
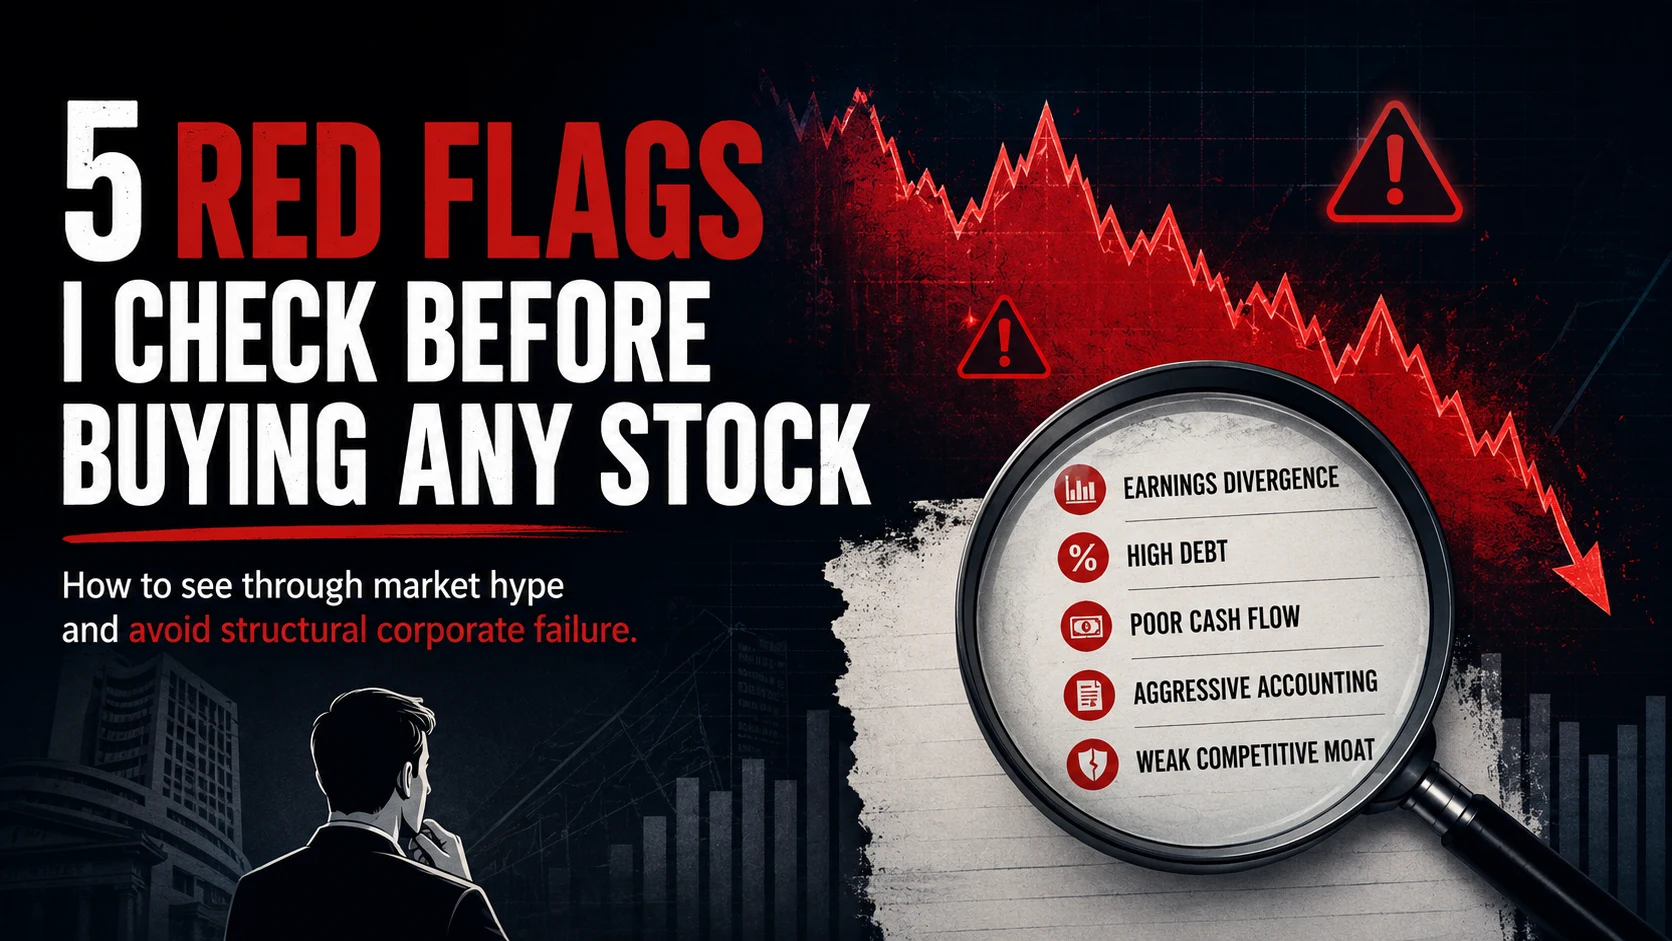
This extensive analysis is going to get you all aware about what we should look out for when buying a business, contrasting superficial market hype with the authentic, original methods of forensic stock vetting. We must learn to screen for red flags before committing our hard-earned capital.
The Illusion of Growth: Divergence Between Net Income and Operating Cash Flow
With modern financial tools, calculating a company's earnings per share (EPS) and revenue growth has become incredibly easy. Millions of investors open an app, see that net income has increased by 15% year-over-year, and immediately conclude that the business is a booming success. This is a classic trap.
One of the most catastrophic red flags in corporate finance is a persistent, widening divergence between reported net income and actual cash flow from operations (CFO). Net income is an accounting construct dictated by accrual accounting principles. It can be easily influenced, delayed, or inflated by aggressive revenue recognition policies, changes in depreciation assumptions, or non-cash paper gains. Operating Cash Flow, on the other hand, records the actual physical currency flowing into and out of the corporate bank accounts from core business operations. When a company reports high profitability on the income statement but reports flat or negative operating cash flow, it means the business is not actually collecting money from its customers.
"Earnings can be manipulated by accounting tricks, but cash is a fact. A business that creates paper profits without hard cash is a house of cards waiting for the wind to change."
Consider the mechanism of Aggressive Revenue Recognition. A company might ship unsold inventory to its distributors at the end of a fiscal quarter — a practice known as "channel stuffing" — and record those shipments immediately as revenue and net income. However, until those products are sold to real consumers and the money is collected, those "profits" exist purely as Accounts Receivable (AR). If accounts receivable are rising at a rate significantly faster than general revenue growth, it indicates that the company is struggling to collect cash from its clients or is artificially inflating its current sales figures. In forensic finance studies, a divergence where net income exceeds operating cash flow for three consecutive years is correlated with an incredibly high corporate distress rate, outperforming standard market screeners by a massive margin.
| Financial Metric Trend | Healthy Growth Profile | Red Flag Alert Profile (Divergence) | Underlying Corporate Reality |
|---|---|---|---|
| Revenue Growth | Steady +10% to +15% per annum | Spiking +25% per annum | Aggressive expansion or channel stuffing |
| Net Income (Accrual) | Proportional to revenue growth | Highly positive & expanding margins | Paper profits inflated by accounting policies |
| Operating Cash Flow | Matches or exceeds Net Income | Stagnant, flat, or severely negative | No real liquidity is entering the business |
| Accounts Receivable | Stable relative to total sales | Skyrocketing (+40% Y/Y) | Customers are not paying for delivered goods |
To evaluate this balance, investors should always calculate the Quality of Earnings ratio, defined as:
Ratio = Cash Flow from Operations ÷ Net Income
If this ratio falls below 1.0 consistently over several quarters, it shows an extreme error in financial health. While automated platforms often group these non-cash adjustments into generalized "working capital changes" without calling out the structural risk, a manual look into the statement of cash flows exposes the true danger before the market adjusts and triggers a heavy loss.
Toxic Balance Sheets: Skyrocketing Debt-to-Equity and Low Interest Coverage
Autonomous financial algorithms often evaluate a company based on its momentum, focusing on how trending its products are in the market or how smart its advancements appear in popular business media. They look at current quarter sales and ignore long-term capital structures. This leads retail investors to buy into high-growth stories without checking if the capital foundation is fundamentally broken.
A skyrocketing Debt-to-Equity (D/E) ratio combined with an unsustainable Interest Coverage Ratio is the second critical red flag that can bankrupt an investor. Debt is leverage; in economic booms, it acts as an accelerator, boosting equity returns. But in times of macroeconomic tightening, high inflation, or unexpected market disruption, debt becomes a lethal weight. When assessing a balance sheet, you must check both short-term obligations and long-term structural liabilities. If total liabilities exceed total shareholder equity by a significant multiple (e.g., a D/E > 2.5 in non-utility sectors), the company is operating on borrowed time.
More importantly, the Interest Coverage Ratio tells us whether the business can comfortably pay the interest charges on its accumulated debt out of its current operational profits. This is calculated using Earnings Before Interest and Taxes (EBIT):
Interest Coverage Ratio = EBIT ÷ Total Interest Expense
In a recent review of historical market downturns, companies with an interest coverage ratio below 1.5 defaulted or underwent painful dilutive restructurings at an alarming rate. When your interest obligations consume the majority of your operating profit, the company has no room for error. It cannot invest in research and development, it cannot adjust to competitive threats, and it cannot maintain its infrastructure. Retail screeners often disguise this threat by presenting adjusted metrics like "Adjusted EBITDA" — which adds back real, painful expenses to make the business look artificially safe. If you do not cross-examine the true interest expenses against unadjusted cash operating profits, you risk walking into a financial trap.
"Investigate capital structures with deep skepticism. Leverage is a fair-weather friend that turns into an executioner when the economic climate shifts."
Aggressive Dilution: Constant Share Issuance and Declining Book Value

Many investors get caught up in lengthy prompts and complex online analyses discussing a stock's potential upside while completely overlooking how their ownership stake is being eroded. Constant share dilution through repeated secondary stock offerings and excessive stock-based compensation (SBC) is a massive red flag. It serves as an internal mechanism that quietly steals value from existing shareholders.
When a company lacks the operational cash flow to fund its business or pay its executives, it routinely prints new shares and sells them onto the open market or issues them to insiders. Every time a company issues additional shares, your fractional ownership slice of that business shrinks. If a company doubles its outstanding share count over five years, it must double its total net income just to keep its Earnings Per Share flat. If net income stays static while share count grows, your investment is actively losing value, even if the headline charts look stable.
Excessive stock-based compensation can also hide structural operational expenses. By paying employees in shares instead of cash, a company can artificially inflate its Operating Cash Flow, because stock issuance is a non-cash expense that gets added back on the cash flow statement. To catch this red flag, you must look beyond the initial charts and track the Total Outstanding Shares Diluted trend over multiple years. If the share count rises by more than 3% to 5% annually without an equivalent expansion in cash flow per share, the company is using public markets as an emergency funding mechanism rather than operating a sustainable business model.
The Goodwill Trap: Asset Inflation via Unproductive Acquisitions
When an executive team runs out of organic ideas to grow their core business, they often turn to expensive corporate acquisitions to maintain the appearance of growth. This introduces the fourth major red flag: an inflated balance sheet dominated by Goodwill and intangible assets, rather than tangible, productive machinery, cash, or real estate.
Goodwill is an accounting line item created when one company buys another company for a price higher than the actual fair market value of its physical assets. For example, if Company A buys a trendy tech startup with $10 million in physical assets for $100 million, the remaining $90 million is recorded on Company A's balance sheet as "Goodwill." This asset represents abstract concepts like brand reputation, future synergy potential, and intellectual property.
The danger arises because goodwill is highly subjective. If the acquired startup fails to achieve its ambitious growth targets or its technology becomes obsolete, accounting rules require the parent company to write down the value of that goodwill. This process, known as a Goodwill Impairment Charge, passes straight through the income statement as a massive non-cash loss. When a company's balance sheet consists of more than 30% or 40% goodwill, it is highly vulnerable to sudden, multi-billion-dollar asset write-downs that can wipe out its entire accounting book value overnight. Algorithmic summaries frequently overlook this because goodwill is classified under "long-term assets," making the business look stable until a massive write-down occurs.
Executive Musical Chairs: Rapid Turnover in the C-Suite and Audit Firms
While financial metrics provide quantitative boundaries, the qualitative behavior of corporate leadership offers vital clues about a company's true condition. The fifth major red flag is rapid executive turnover — specifically the sudden, unexpected resignation of the Chief Financial Officer (CFO), Chief Executive Officer (CEO), or the sudden dismissal of the independent auditing firm.
The CFO is the primary custodian of a corporation's financial integrity. They see the real-time cash records, the tax strategies, and the internal friction regarding accounting choices. When a CFO abruptly resigns to "pursue other opportunities" or leaves unexpectedly in the middle of a fiscal year, it is rarely a coincidence. Historical market data shows that unexpected CFO departures are frequently followed by financial restatements, regulatory investigations, or sudden drops in operational earnings within the next 12 to 18 months.
Similarly, a sudden change in the independent accounting firm auditing the company's books should immediately put you on high alert. When management and their auditors disagree over revenue recognition, inventory valuations, or disclosure requirements, the company may terminate the relationship to find a more compliant auditor. If a company changes its independent auditor outside of standard corporate rotation cycles, it often indicates that management is attempting to disguise financial issues that an honest auditor refused to approve. Reviewing these structural governance shifts requires human diligence and skepticism — qualities that automated tools often miss while focusing purely on price charts.
"Analyze consciously and execute intentionally."
The Power of Manual Auditing: Why Human Scrutiny Beats the Algorithm
It may sound like modern online stock screeners can perform these checks instantly for you with a click of a button. But no — this is where the true power of manual corporate analysis becomes apparent. When you read through a company's 10-K filing yourself, review the footnotes to the financial statements, and calculate these ratios by hand, your mind becomes deeply aware of the structural realities of the business. You learn to spot if it is safe or unsafe to risk your capital on a stock. This practice forces you to think twice before investing your money, which remains the core foundation of successful wealth management and capital preservation.
Relying completely on automated finance tools or trending market headlines can pull investors into a frustrating cycle of buying overvalued assets, missing structural errors, and reacting too late to market shifts. This turns stock picking into a stressful chore that consumes time and mental energy while producing inconsistent results. By returning to a deliberate, human-centric process of financial auditing, we protect our investments from systemic market failures and build long-term financial discipline.
Read Further
- SEC EDGAR Full-Text Search System — Official Archive for Manual 10-K and 10-Q Corporate Statement Cross-Examination, U.S. Securities and Exchange Commission
- Damodaran Online Corporate Finance Data — Sector-by-Sector Baseline Capital Structures and Interest Coverage Metrics, Aswath Damodaran, NYU Stern
- PCAOB AuditorSearch & Inspection Reports — Official Portal to Investigate Independent Accounting Firm Changes and Regulatory Quality Disputes, Public Company Accounting Oversight Board
Disclaimer: All the data, metrics, and study references provided above were compiled from general financial market resources, public corporate filings, and historical financial case studies. This content is for educational and informational purposes only and should not be construed as direct financial advice, an endorsement, or a specific recommendation to buy or sell any corporate security. Always consult with a licensed professional financial advisor before making any investment decisions.